MSstatsPTM LabelFree Workflow
Devon Kohler (kohler.d@northeastern.edu)
2021-05-21
Source:vignettes/MSstatsPTM_LabelFree_Workflow.Rmd
MSstatsPTM_LabelFree_Workflow.Rmd
library(MSstatsPTM)This Vignette provides an example workflow for how to use the package MSstatsPTM for a labelfree dataset. It also provides examples and an analysis of how adjusting for global protein levels allows for better interpretations of PTM modeling results.
Installation
To install this package, start R (version “4.0”) and enter:
if (!requireNamespace("BiocManager", quietly = TRUE))
    install.packages("BiocManager")

BiocManager::install("MSstatsPTM")
1. Workflow
1.1 Raw Data Format
Note: We are actively developing dedicated converters for MSstatsPTM. If you have data from a processing tool that does not have a dedicated converter in MSstatsPTM please add a github issue https://github.com/Vitek-Lab/MSstatsPTM/issues and we will add the converter.
The first step is to load in the raw dataset for both the PTM and Protein datasets. Each dataset can formatted using dedicated converters in MSstatsPTM, such as ProgenesistoMSstatsPTMFormat, or converters from base MSstats such as SkylinetoMSstatsFormat, MaxQtoMSstatsFormat, ProgenesistoMSstatsFormat, ect. If using converters from MSstats note they will need to be run both on the global protein and PTM datasets.
Please note for the PTM dataset, both the protein and modification site (or peptide), must be added into the ProteinName column. This allows for the package to summarize to the peptide level, and avoid the off chance there are matching peptides between proteins. For an example of how this can be done please see the code below.
1.1.1 Raw Data Converter
annotation <- data.frame('Condition' = c('Control', 'Control', 'Control',
                                         'Treatment', 'Treatment', 'Treatment'),
                         'BioReplicate' = c(1,2,3,4,5,6),
                         'Run' = c('prot_run_1', 'prot_run_2', 'prot_run_3',
                                   'phos_run_1', 'phos_run_2', 'phos_run_3'),
                         'Type' = c("Protein", "Protein", "Protein", "PTM",
                                    "PTM", "PTM"))

# Run MSstatsPTM converter with modified and unmodified datasets.
raw.input <- ProgenesistoMSstatsPTMFormat(raw_ptm_df, annotation,
                                          raw_protein_df, fasta_path)
The output of the converter is a list with two formatted data.tables. One each for the PTM and Protein datasets.
If there is not a dedicated MSstatsPTM converter for a processing tool, base MSstats converters can be used as follows. Please note ProteinName column must be a combination of the Protein Name and sitename.
# Add site into ProteinName column
raw_ptm_df$ProteinName <- paste(raw_ptm_df$ProteinName,
                                raw_ptm_df$Site, sep = "_")

# Run MSstats Converters
PTM.data <- ProgenesistoMSstatsFormat(raw_ptm_df, annotation)
PROTEIN.data <- ProgenesistoMSstatsFormat(raw_protein_df, annotation)

# Combine into one list
raw.input <- list(PTM = PTM.data,
                  PROTEIN = PROTEIN.data)
Both of these conversion methods will output the same results.
head(raw.input$PTM)
#> # A tibble: 6 x 10
#>   ProteinName PeptideSequence Condition BioReplicate Run        Intensity
#>   <chr>       <chr>           <chr>     <chr>        <chr>          <dbl>
#> 1 Q9UHD8_K262 DAGLK*QAPASR    CCCP      BCH1         CCCP-B1T1   1423906.
#> 2 Q9UHD8_K262 DAGLK*QAPASR    CCCP      BCH1         CCCP-B1T2    877045.
#> 3 Q9UHD8_K262 DAGLK*QAPASR    CCCP      BCH2         CCCP-B2T1    384418.
#> 4 Q9UHD8_K262 DAGLK*QAPASR    CCCP      BCH2         CCCP-B2T2    454858.
#> 5 Q9UHD8_K262 DAGLK*QAPASR    Combo     BCH1         Combo-B1T1  1603377.
#> 6 Q9UHD8_K262 DAGLK*QAPASR    Combo     BCH1         Combo-B1T2   676555.
#> # ... with 4 more variables: PrecursorCharge <chr>, FragmentIon <lgl>,
#> #   ProductCharge <lgl>, IsotopeLabelType <chr>
head(raw.input$PROTEIN)
#> # A tibble: 6 x 10
#>   ProteinName PeptideSequence Condition BioReplicate Run           Intensity
#>   <chr>       <chr>           <chr>     <chr>        <chr>             <dbl>
#> 1 Q9UHD8      STLINTLFK       CCCP      BCH2         CCCP-B2T1       367944.
#> 2 Q9UHD8      STLINTLFK       CCCP      BCH2         CCCP-B2T2       341207.
#> 3 Q9UHD8      STLINTLFK       Combo     BCH2         Combo-B2T1      185843.
#> 4 Q9UHD8      STLINTLFK       Ctrl      BCH2         Ctrl-B2T1       529224.
#> 5 Q9UHD8      STLINTLFK       Ctrl      BCH2         Ctrl-B2T2       483355.
#> 6 Q9UHD8      STLINTLFK       USP30_OE  BCH2         USP30_OE-B2T1   447795.
#> # ... with 4 more variables: PrecursorCharge <chr>, FragmentIon <lgl>,
#> #   ProductCharge <lgl>, IsotopeLabelType <chr>
1.2 Summarization - dataSummarizationPTM
After loading in the input data, the next step is to use the dataSummarizationPTM function. This provides the summarized dataset needed to model the protein/PTM abundance. The function will summarize the Protein dataset up to the protein level and will summarize the PTM dataset up to the peptide level. There are multiple options for normalization and missing value imputation. These options should be reviewed in the package documentation.
MSstatsPTM.summary <- dataSummarizationPTM(raw.input, verbose = FALSE)
#>
|
| | 0%
|
|= | 1%
|
|= | 2%
|
|== | 2%
|
|== | 3%
|
|=== | 4%
|
|=== | 5%
|
|==== | 6%
|
|===== | 7%
|
|====== | 8%
|
|====== | 9%
|
|======= | 10%
|
|======== | 11%
|
|======== | 12%
|
|========= | 13%
|
|========== | 14%
|
|=========== | 15%
|
|=========== | 16%
|
|============ | 17%
|
|============ | 18%
|
|============= | 18%
|
|============= | 19%
|
|============== | 20%
|
|=============== | 21%
|
|=============== | 22%
|
|================ | 22%
|
|================ | 23%
|
|================= | 24%
|
|================= | 25%
|
|================== | 26%
|
|=================== | 27%
|
|==================== | 28%
|
|==================== | 29%
|
|===================== | 30%
|
|====================== | 31%
|
|====================== | 32%
|
|======================= | 33%
|
|======================== | 34%
|
|========================= | 35%
|
|========================= | 36%
|
|========================== | 37%
|
|========================== | 38%
|
|=========================== | 38%
|
|=========================== | 39%
|
|============================ | 40%
|
|============================= | 41%
|
|============================= | 42%
|
|============================== | 42%
|
|============================== | 43%
|
|=============================== | 44%
|
|=============================== | 45%
|
|================================ | 46%
|
|================================= | 47%
|
|================================== | 48%
|
|================================== | 49%
|
|=================================== | 50%
|
|==================================== | 51%
|
|==================================== | 52%
|
|===================================== | 53%
|
|====================================== | 54%
|
|======================================= | 55%
|
|======================================= | 56%
|
|======================================== | 57%
|
|======================================== | 58%
|
|========================================= | 58%
|
|========================================= | 59%
|
|========================================== | 60%
|
|=========================================== | 61%
|
|=========================================== | 62%
|
|============================================ | 62%
|
|============================================ | 63%
|
|============================================= | 64%
|
|============================================= | 65%
|
|============================================== | 66%
|
|=============================================== | 67%
|
|================================================ | 68%
|
|================================================ | 69%
|
|================================================= | 70%
|
|================================================== | 71%
|
|================================================== | 72%
|
|=================================================== | 73%
|
|==================================================== | 74%
|
|===================================================== | 75%
|
|===================================================== | 76%
|
|====================================================== | 77%
|
|====================================================== | 78%
|
|======================================================= | 78%
|
|======================================================= | 79%
|
|======================================================== | 80%
|
|========================================================= | 81%
|
|========================================================= | 82%
|
|========================================================== | 82%
|
|========================================================== | 83%
|
|=========================================================== | 84%
|
|=========================================================== | 85%
|
|============================================================ | 86%
|
|============================================================= | 87%
|
|============================================================== | 88%
|
|============================================================== | 89%
|
|=============================================================== | 90%
|
|================================================================ | 91%
|
|================================================================ | 92%
|
|================================================================= | 93%
|
|================================================================== | 94%
|
|=================================================================== | 95%
|
|=================================================================== | 96%
|
|==================================================================== | 97%
|
|==================================================================== | 98%
|
|===================================================================== | 98%
|
|===================================================================== | 99%
|
|======================================================================| 100%
#>
|
| | 0%
|
|=== | 4%
|
|===== | 8%
|
|======== | 12%
|
|=========== | 15%
|
|============= | 19%
|
|================ | 23%
|
|=================== | 27%
|
|====================== | 31%
|
|======================== | 35%
|
|=========================== | 38%
|
|============================== | 42%
|
|================================ | 46%
|
|=================================== | 50%
|
|====================================== | 54%
|
|======================================== | 58%
|
|=========================================== | 62%
|
|============================================== | 65%
|
|================================================ | 69%
|
|=================================================== | 73%
|
|====================================================== | 77%
|
|========================================================= | 81%
|
|=========================================================== | 85%
|
|============================================================== | 88%
|
|================================================================= | 92%
|
|=================================================================== | 96%
|
|======================================================================| 100%
head(MSstatsPTM.summary$PTM$ProteinLevelData)
#> RUN Protein LogIntensities originalRUN GROUP SUBJECT
#> 1 3 Q9UHD8_K028 20.40683 CCCP-B2T1 CCCP BCH2
#> 2 4 Q9UHD8_K028 20.42412 CCCP-B2T2 CCCP BCH2
#> 3 7 Q9UHD8_K028 20.62455 Combo-B2T1 Combo BCH2
#> 4 8 Q9UHD8_K028 20.72569 Combo-B2T2 Combo BCH2
#> 5 11 Q9UHD8_K028 20.40666 Ctrl-B2T1 Ctrl BCH2
#> 6 12 Q9UHD8_K028 20.65381 Ctrl-B2T2 Ctrl BCH2
#> TotalGroupMeasurements NumMeasuredFeature MissingPercentage more50missing
#> 1 4 1 0 FALSE
#> 2 4 1 0 FALSE
#> 3 4 1 0 FALSE
#> 4 4 1 0 FALSE
#> 5 4 1 0 FALSE
#> 6 4 1 0 FALSE
#> NumImputedFeature
#> 1 0
#> 2 0
#> 3 0
#> 4 0
#> 5 0
#> 6 0
head(MSstatsPTM.summary$PROTEIN$ProteinLevelData)
#> RUN Protein LogIntensities originalRUN GROUP SUBJECT
#> 1 3 Q9UHD8 19.36883 CCCP-B2T1 CCCP BCH2
#> 2 4 Q9UHD8 19.56289 CCCP-B2T2 CCCP BCH2
#> 3 7 Q9UHD8 18.69612 Combo-B2T1 Combo BCH2
#> 4 11 Q9UHD8 19.77119 Ctrl-B2T1 Ctrl BCH2
#> 5 12 Q9UHD8 19.62490 Ctrl-B2T2 Ctrl BCH2
#> 6 15 Q9UHD8 19.16970 USP30_OE-B2T1 USP30_OE BCH2
#> TotalGroupMeasurements NumMeasuredFeature MissingPercentage more50missing
#> 1 4 1 0 FALSE
#> 2 4 1 0 FALSE
#> 3 4 1 0 FALSE
#> 4 4 1 0 FALSE
#> 5 4 1 0 FALSE
#> 6 4 1 0 FALSE
#> NumImputedFeature
#> 1 0
#> 2 0
#> 3 0
#> 4 0
#> 5 0
#> 6 0The summarize function returns a list with PTM and Protein summarization information. Each PTM and Protein include a list of data.tables: FeatureLevelData is a data.table of reformatted input of dataSummarizationPTM, ProteinLevelData is the run level summarization data.
1.2.1 QCPlot
Once summarized, MSstatsPTM provides multiple plots to analyze the experiment. Here we show the quality control boxplot. The first plot shows the modified data and the second plot shows the global protein dataset.
dataProcessPlotsPTM(MSstatsPTM.summary,
                    type = 'QCPLOT',
                    which.PTM = "allonly",
                    address = FALSE)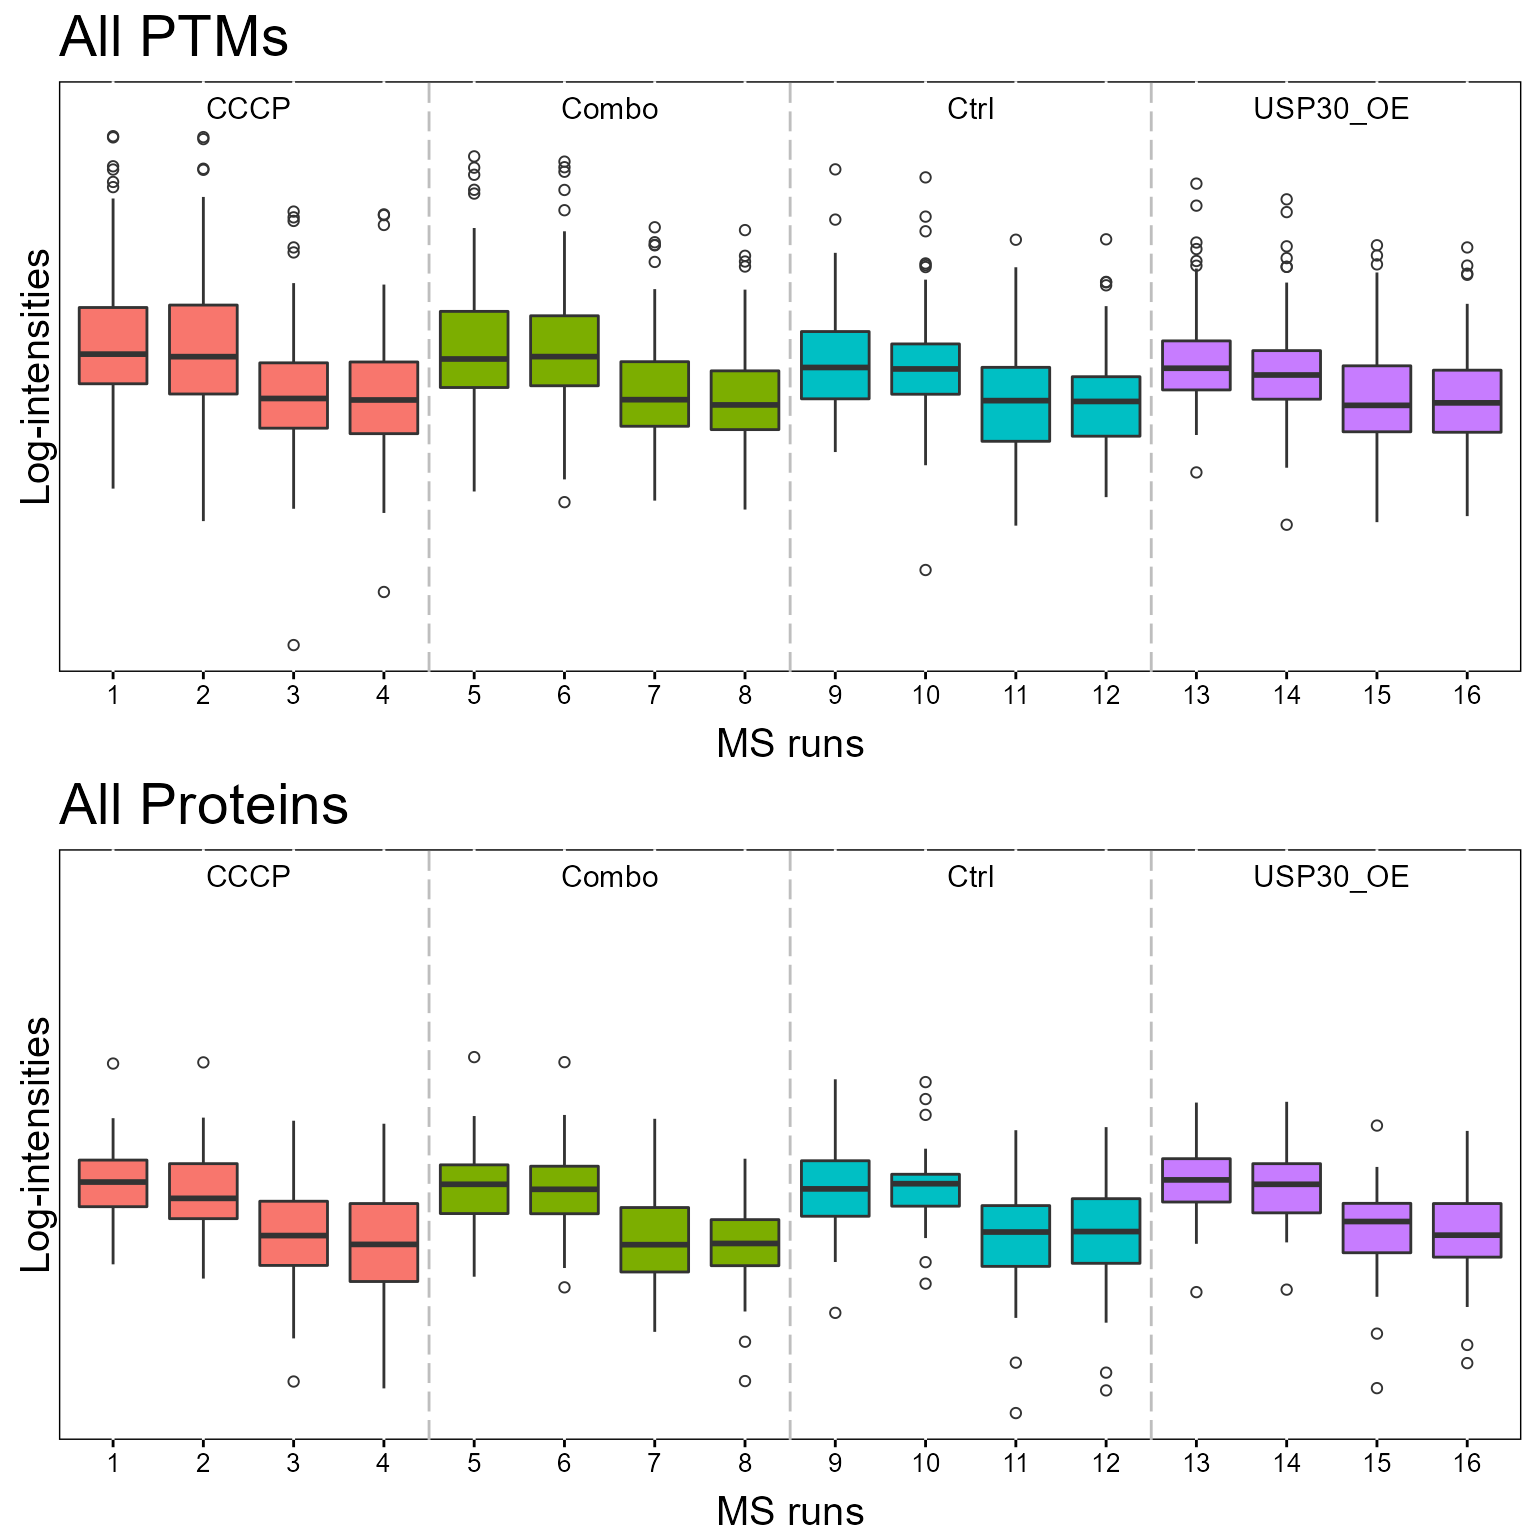
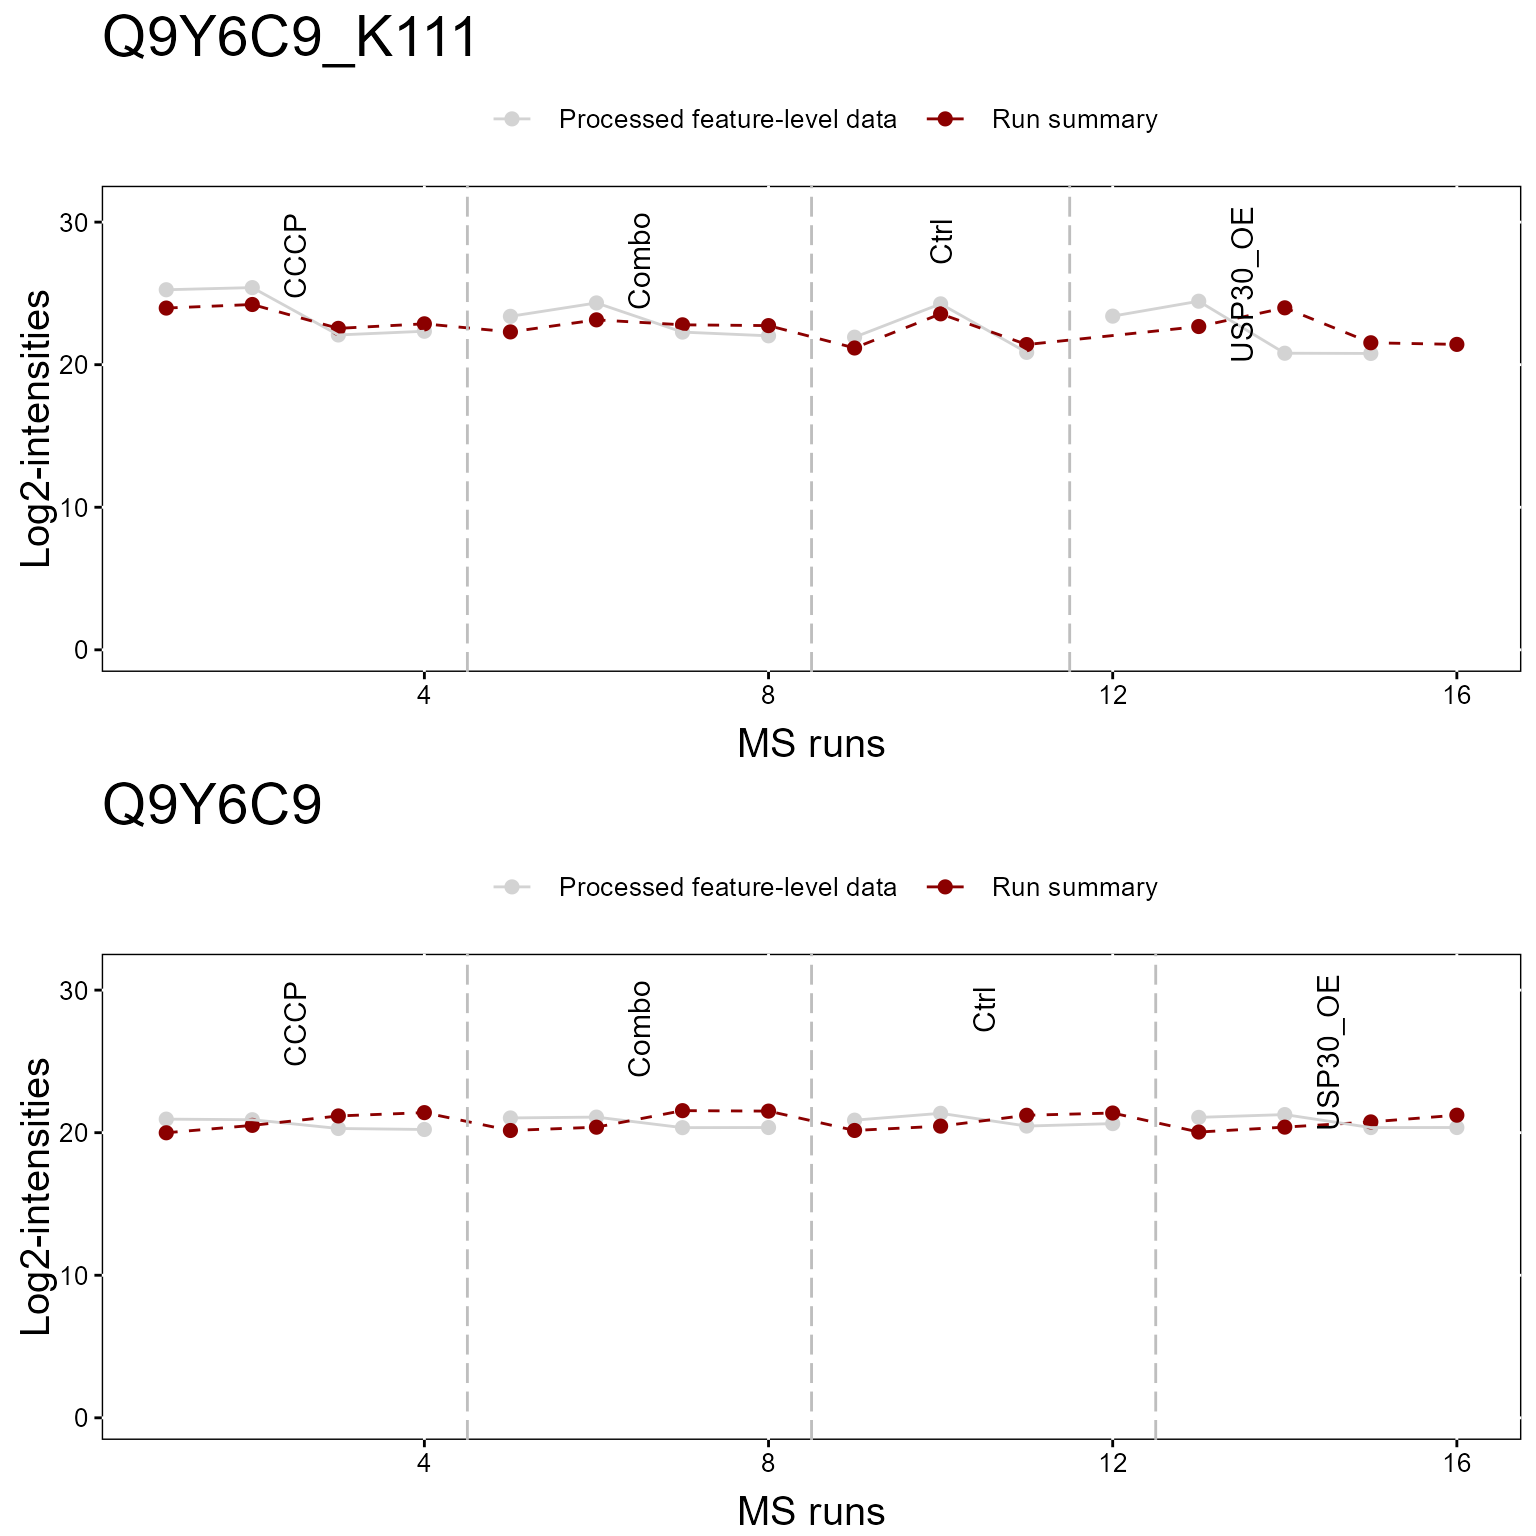
1.2.2 Profile Plot
Here we show a profile plot. Again the top plot shows the modified peptide, and the bottom shows the overall protein.
dataProcessPlotsPTM(MSstatsPTM.summary,
                    type = 'ProfilePlot',
                    which.Protein = "Q9Y6C9",
                    address = FALSE)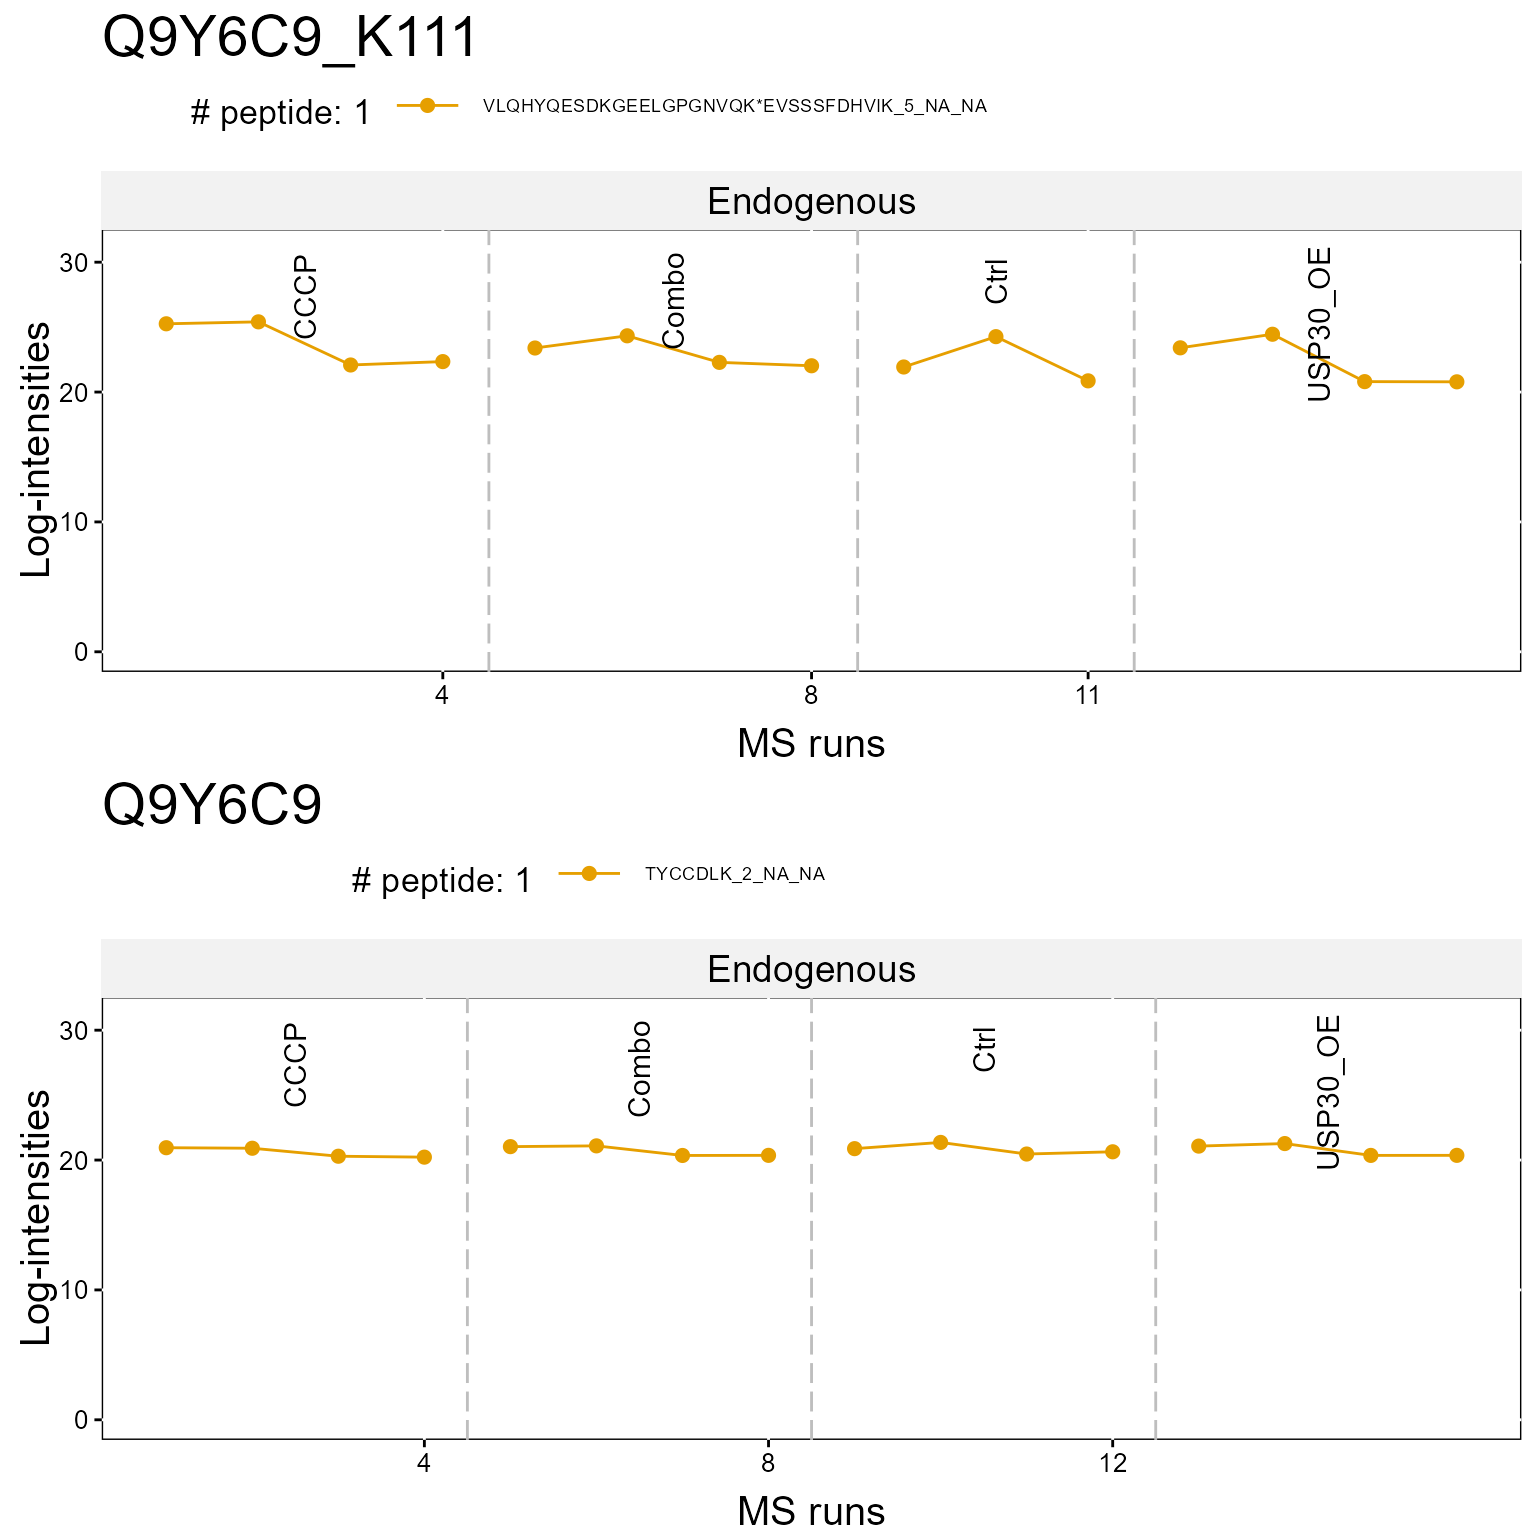
1.3 Modeling - groupComparisonPTM
After summarization, the summarized datasets can be modeled using the groupComparisonPTM function. This function will model the PTM and Protein summarized datasets, and then adjust the PTM model for changes in overall protein abundance. The output of the function is a list containing these three models named: PTM.Model, PROTEIN.Model, ADJUSTED.Model.
# Specify contrast matrix
comparison <- matrix(c(-1,0,1,0),nrow=1)
row.names(comparison) <- "CCCP-Ctrl"
colnames(comparison) <- c("CCCP", "Combo", "Ctrl", "USP30_OE")
MSstatsPTM.model <- groupComparisonPTM(MSstatsPTM.summary,
data.type = "LabelFree",
contrast.matrix = comparison,
verbose = FALSE)
#>
|
| | 0%
|
|= | 1%
|
|= | 2%
|
|== | 2%
|
|== | 3%
|
|=== | 4%
|
|=== | 5%
|
|==== | 6%
|
|===== | 7%
|
|====== | 8%
|
|====== | 9%
|
|======= | 10%
|
|======== | 11%
|
|======== | 12%
|
|========= | 13%
|
|========== | 14%
|
|=========== | 15%
|
|=========== | 16%
|
|============ | 17%
|
|============ | 18%
|
|============= | 18%
|
|============= | 19%
|
|============== | 20%
|
|=============== | 21%
|
|=============== | 22%
|
|================ | 22%
|
|================ | 23%
|
|================= | 24%
|
|================= | 25%
|
|================== | 26%
|
|=================== | 27%
|
|==================== | 28%
|
|==================== | 29%
|
|===================== | 30%
|
|====================== | 31%
|
|====================== | 32%
|
|======================= | 33%
|
|======================== | 34%
|
|========================= | 35%
|
|========================= | 36%
|
|========================== | 37%
|
|========================== | 38%
|
|=========================== | 38%
|
|=========================== | 39%
|
|============================ | 40%
|
|============================= | 41%
|
|============================= | 42%
|
|============================== | 42%
|
|============================== | 43%
|
|=============================== | 44%
|
|=============================== | 45%
|
|================================ | 46%
|
|================================= | 47%
|
|================================== | 48%
|
|================================== | 49%
|
|=================================== | 50%
|
|==================================== | 51%
|
|==================================== | 52%
|
|===================================== | 53%
|
|====================================== | 54%
|
|======================================= | 55%
|
|======================================= | 56%
|
|======================================== | 57%
|
|======================================== | 58%
|
|========================================= | 58%
|
|========================================= | 59%
|
|========================================== | 60%
|
|=========================================== | 61%
|
|=========================================== | 62%
|
|============================================ | 62%
|
|============================================ | 63%
|
|============================================= | 64%
|
|============================================= | 65%
|
|============================================== | 66%
|
|=============================================== | 67%
|
|================================================ | 68%
|
|================================================ | 69%
|
|================================================= | 70%
|
|================================================== | 71%
|
|================================================== | 72%
|
|=================================================== | 73%
|
|==================================================== | 74%
|
|===================================================== | 75%
|
|===================================================== | 76%
|
|====================================================== | 77%
|
|====================================================== | 78%
|
|======================================================= | 78%
|
|======================================================= | 79%
|
|======================================================== | 80%
|
|========================================================= | 81%
|
|========================================================= | 82%
|
|========================================================== | 82%
|
|========================================================== | 83%
|
|=========================================================== | 84%
|
|=========================================================== | 85%
|
|============================================================ | 86%
|
|============================================================= | 87%
|
|============================================================== | 88%
|
|============================================================== | 89%
|
|=============================================================== | 90%
|
|================================================================ | 91%
|
|================================================================ | 92%
|
|================================================================= | 93%
|
|================================================================== | 94%
|
|=================================================================== | 95%
|
|=================================================================== | 96%
|
|==================================================================== | 97%
|
|==================================================================== | 98%
|
|===================================================================== | 98%
|
|===================================================================== | 99%
|
|======================================================================| 100%
#>
|
| | 0%
|
|=== | 4%
|
|===== | 8%
|
|======== | 12%
|
|=========== | 15%
|
|============= | 19%
|
|================ | 23%
|
|=================== | 27%
|
|====================== | 31%
|
|======================== | 35%
|
|=========================== | 38%
|
|============================== | 42%
|
|================================ | 46%
|
|=================================== | 50%
|
|====================================== | 54%
|
|======================================== | 58%
|
|=========================================== | 62%
|
|============================================== | 65%
|
|================================================ | 69%
|
|=================================================== | 73%
|
|====================================================== | 77%
|
|========================================================= | 81%
|
|=========================================================== | 85%
|
|============================================================== | 88%
|
|================================================================= | 92%
|
|=================================================================== | 96%
|
|======================================================================| 100%
head(MSstatsPTM.model$PTM.Model)
#> Protein Label log2FC SE Tvalue DF pvalue adj.pvalue
#> 1: Q9UHD8_K028 CCCP-Ctrl 0.1147642 0.09463998 1.2126393 4 0.2919872 0.4201767
#> 2: Q9UHD8_K069 CCCP-Ctrl 0.2688399 0.41750153 0.6439256 8 0.5376428 0.6473658
#> 3: Q9UHD8_K141 CCCP-Ctrl 0.7141059 1.15951976 0.6158635 3 0.5815577 0.6642347
#> 4: Q9UHD8_K262 CCCP-Ctrl 0.3076673 0.41648528 0.7387232 8 0.4811835 0.5976805
#> 5: Q9UHQ9_K046 CCCP-Ctrl 1.0516086 0.63193681 1.6641040 4 0.1714238 0.2889715
#> 6: Q9UHQ9_K062 CCCP-Ctrl 7.4586281 3.91369471 1.9057767 4 0.1293742 0.2336522
#> issue MissingPercentage ImputationPercentage
#> 1: <NA> 0.5 0
#> 2: <NA> 0.0 0
#> 3: <NA> 0.5 0
#> 4: <NA> 0.0 0
#> 5: <NA> 0.5 0
#> 6: <NA> 0.5 0
head(MSstatsPTM.model$PROTEIN.Model)
#> Protein Label log2FC SE Tvalue DF pvalue adj.pvalue
#> 1: Q9UHD8 CCCP-Ctrl 0.2321867 0.3054474 0.7601529 3 0.502444586 0.67065761
#> 2: Q9UHQ9 CCCP-Ctrl -0.1543455 0.1532654 -1.0070472 4 0.370886065 0.64286918
#> 3: Q9UIA9 CCCP-Ctrl 0.1738736 0.1096855 1.5852005 9 0.147381886 0.33080672
#> 4: Q9UIF8 CCCP-Ctrl 1.1429060 0.2462052 4.6420872 4 0.009718807 0.06317225
#> 5: Q9UL25 CCCP-Ctrl -2.0671120 0.2668733 -7.7456678 3 0.004475377 0.03878660
#> 6: Q9UM54 CCCP-Ctrl -0.3602191 0.4761387 -0.7565424 8 0.471013931 0.67065761
#> issue MissingPercentage ImputationPercentage
#> 1: NA 0.5000000 0.0000000
#> 2: NA 0.5000000 0.0000000
#> 3: NA 0.2500000 0.2500000
#> 4: NA 0.5000000 0.0000000
#> 5: NA 0.5000000 0.0000000
#> 6: NA 0.3333333 0.3333333
head(MSstatsPTM.model$ADJUSTED.Model)
#> Protein Label log2FC SE Tvalue DF pvalue
#> 1: Q9UHD8_K028 CCCP-Ctrl -0.11742259 0.3197731 -0.36720591 3.578917 0.7341316
#> 2: Q9UHD8_K069 CCCP-Ctrl 0.03665317 0.5173062 0.07085392 10.689428 0.9448222
#> 3: Q9UHD8_K141 CCCP-Ctrl 0.48191914 1.1990764 0.40190862 3.414364 0.7116107
#> 4: Q9UHD8_K262 CCCP-Ctrl 0.07548059 0.5164863 0.14614248 10.680564 0.8865306
#> 5: Q9UHQ9_K046 CCCP-Ctrl 1.20595408 0.6502572 1.85458014 4.468955 0.1297166
#> 6: Q9UHQ9_K062 CCCP-Ctrl 7.61297362 3.9166946 1.94372408 4.012269 0.1236293
#> adj.pvalue GlobalProtein
#> 1: 0.8250241 Q9UHD8
#> 2: 0.9694697 Q9UHD8
#> 3: 0.8074044 Q9UHD8
#> 4: 0.9176370 Q9UHD8
#> 5: 0.2319176 Q9UHQ9
#> 6: 0.2244347 Q9UHQ91.3.1 Volcano Plot
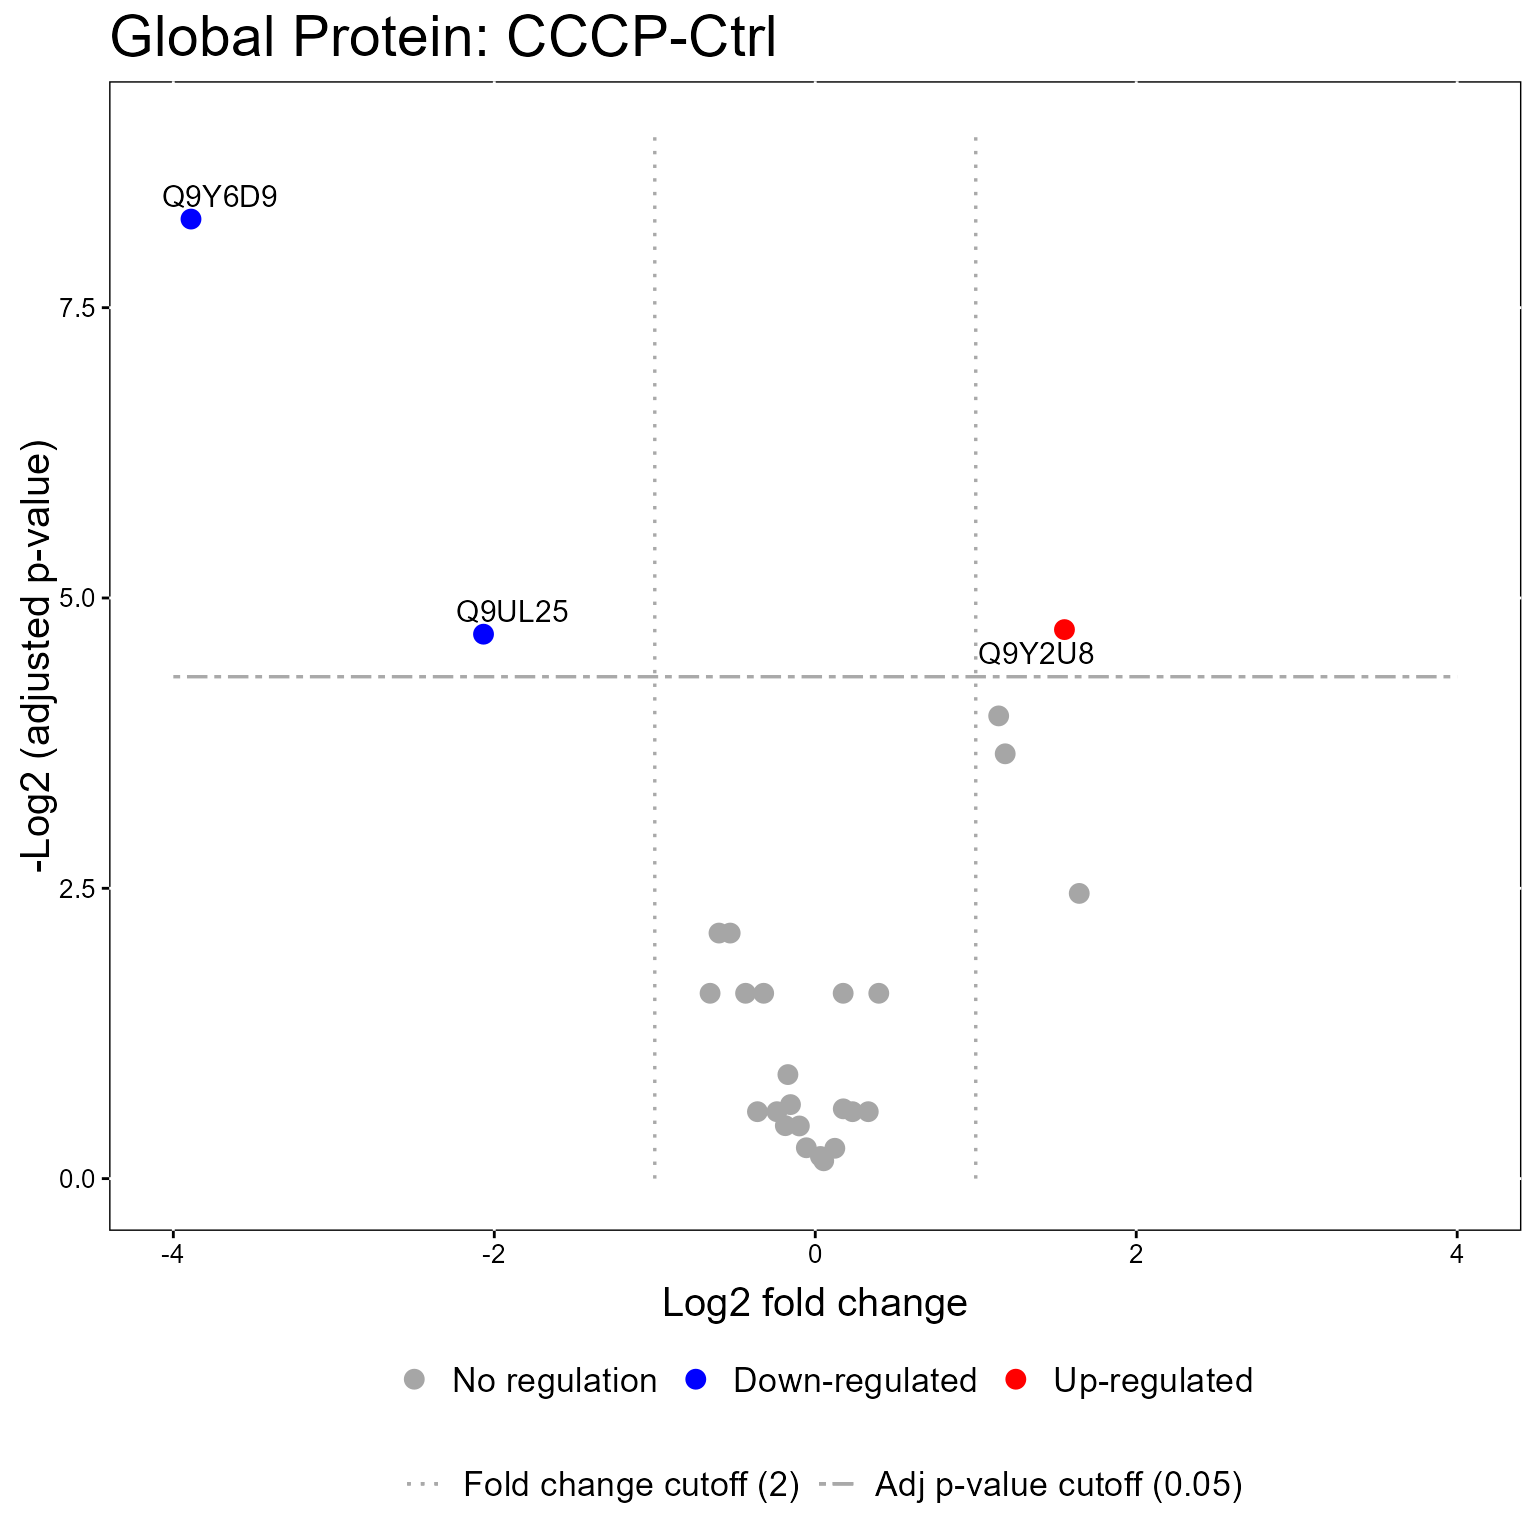
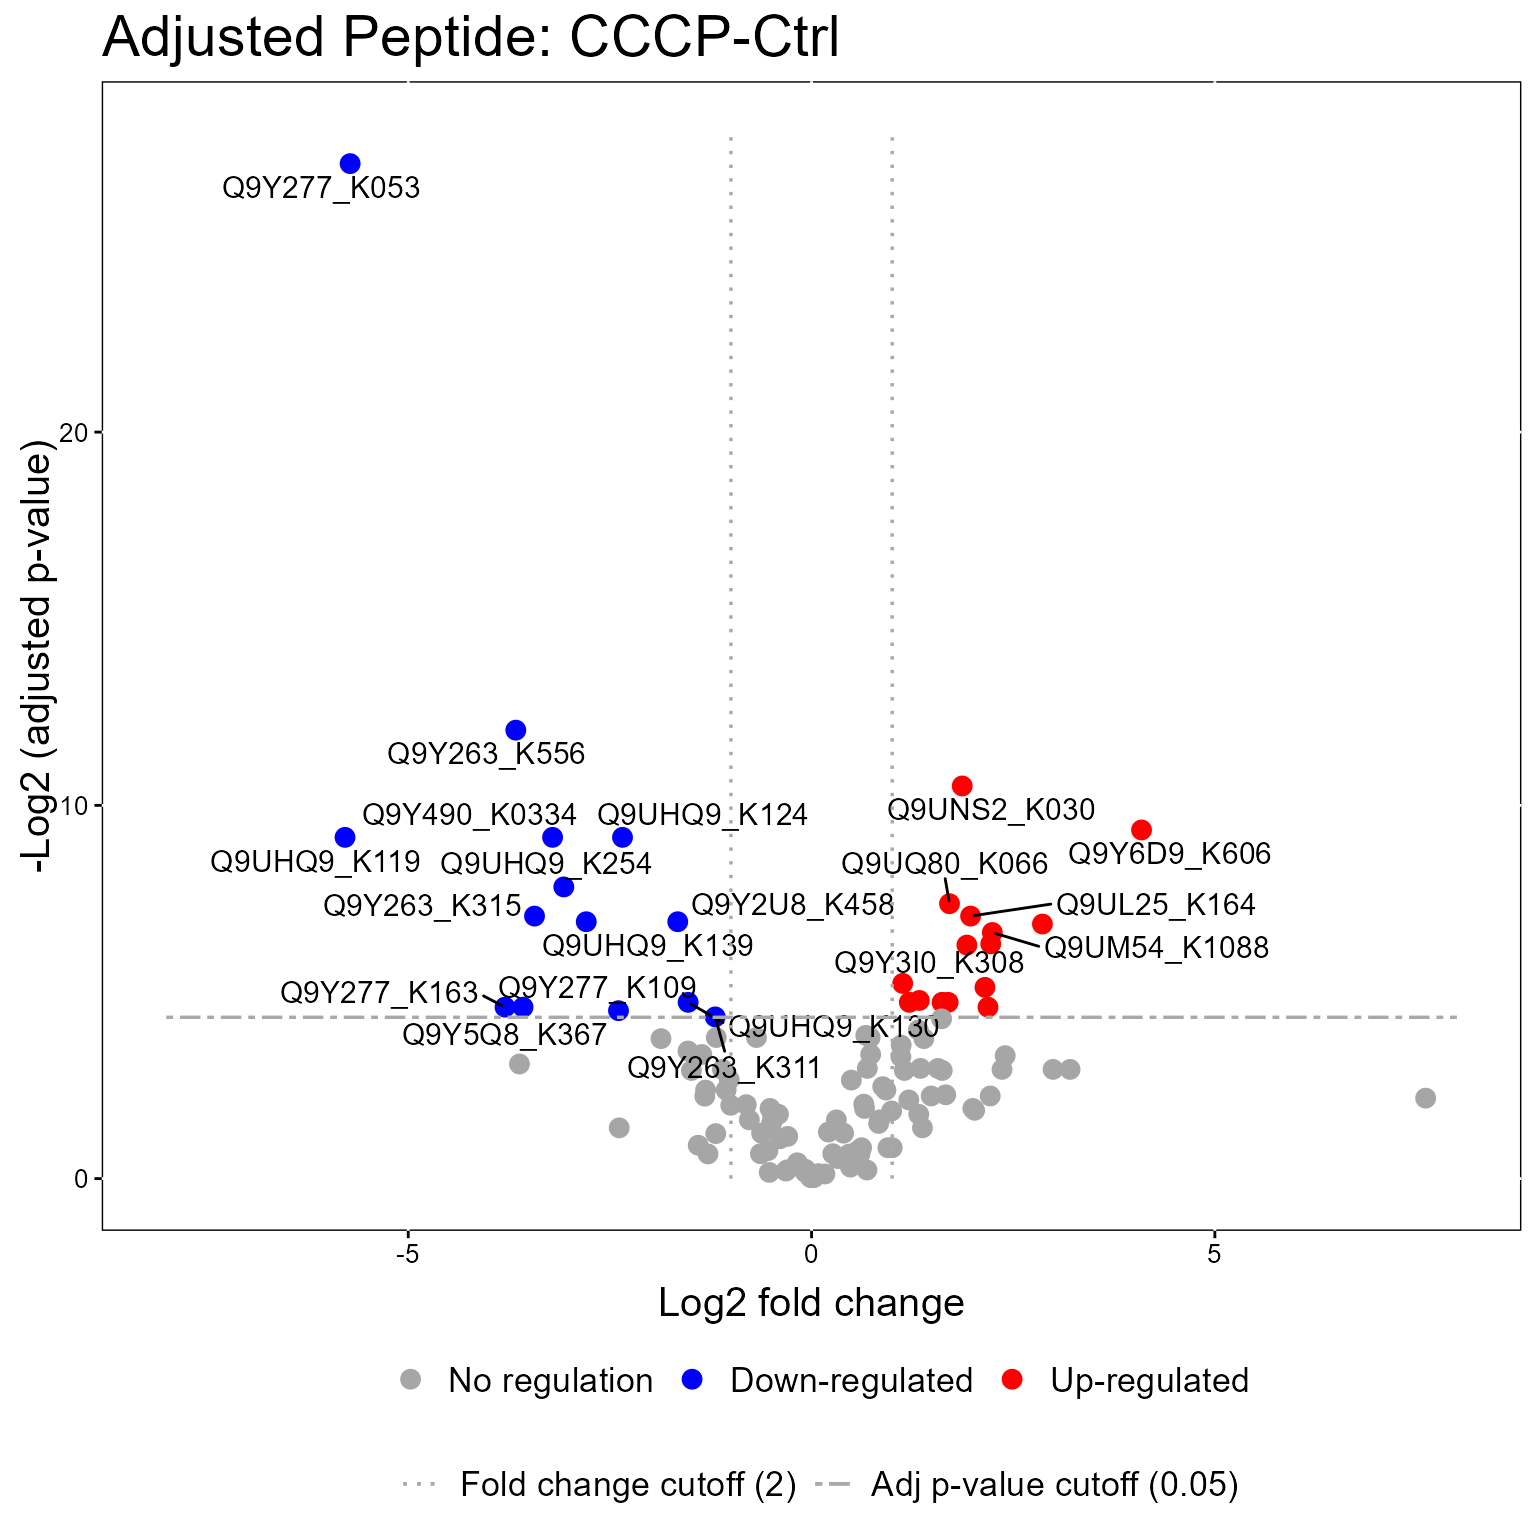
The models from the groupComparisonPTM function can be used in the model visualization function, groupComparisonPlotsPTM. Here we show Volcano Plots for the models.
groupComparisonPlotsPTM(data = MSstatsPTM.model,
                        type = "VolcanoPlot",
                        FCcutoff= 2,
                        logBase.pvalue = 2,
                        address=FALSE)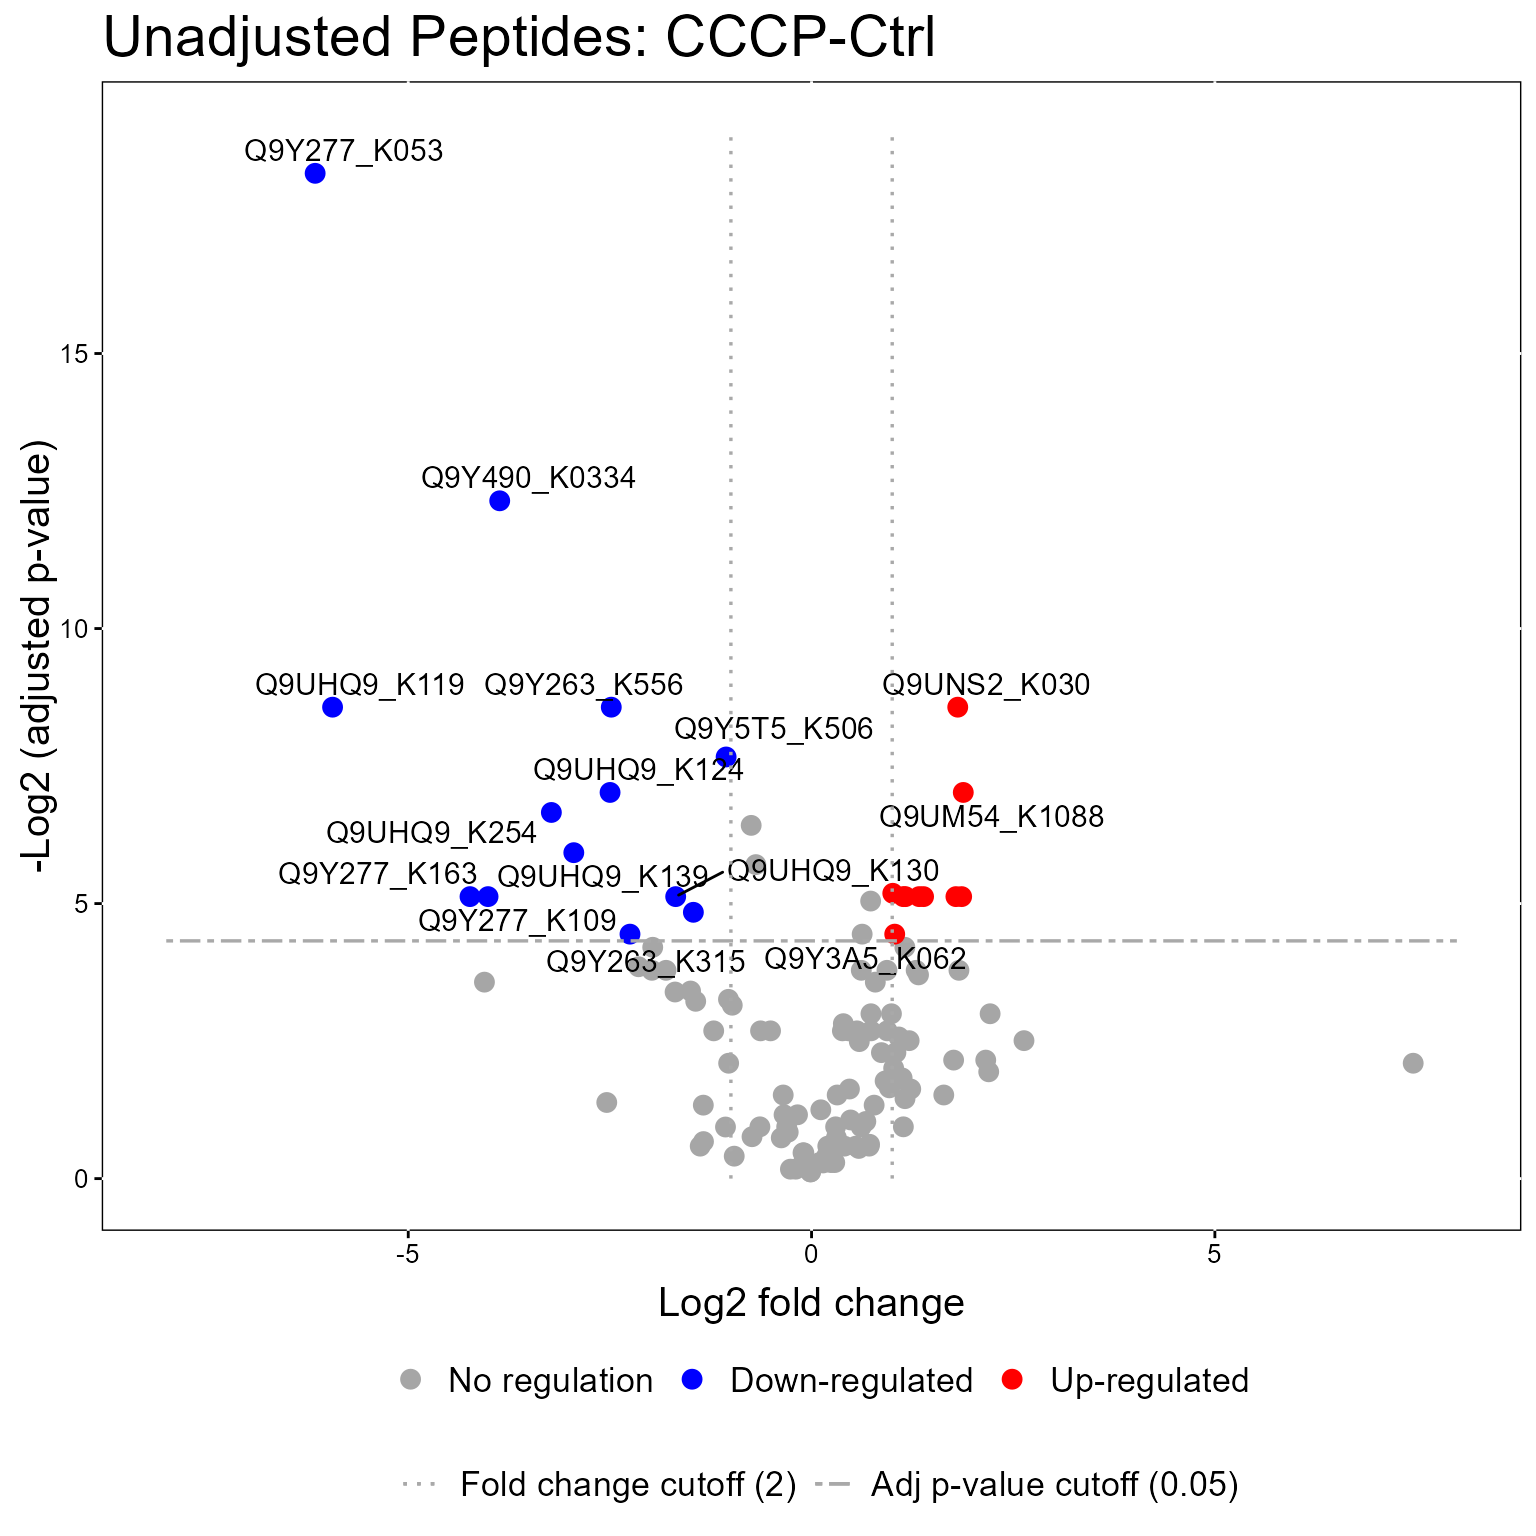
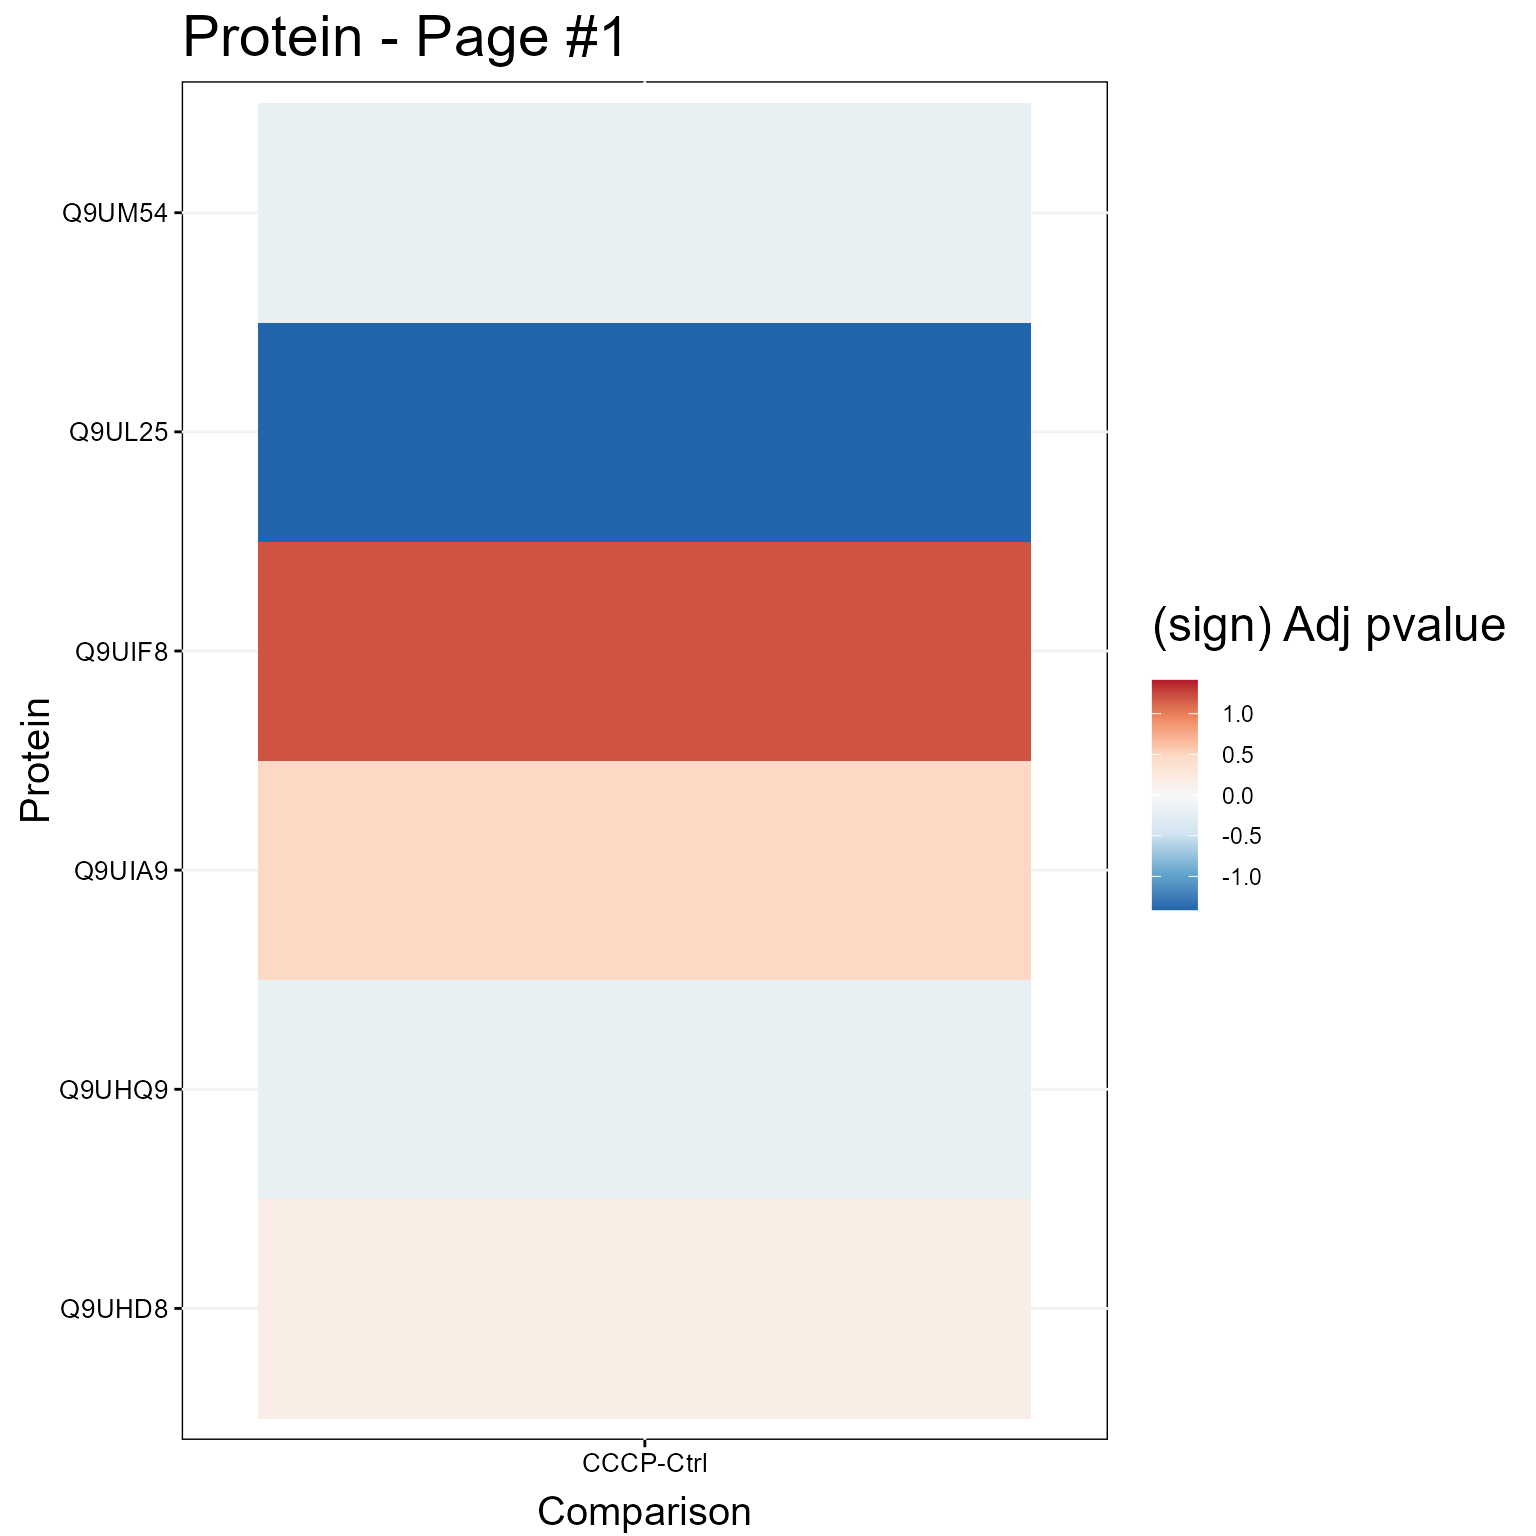
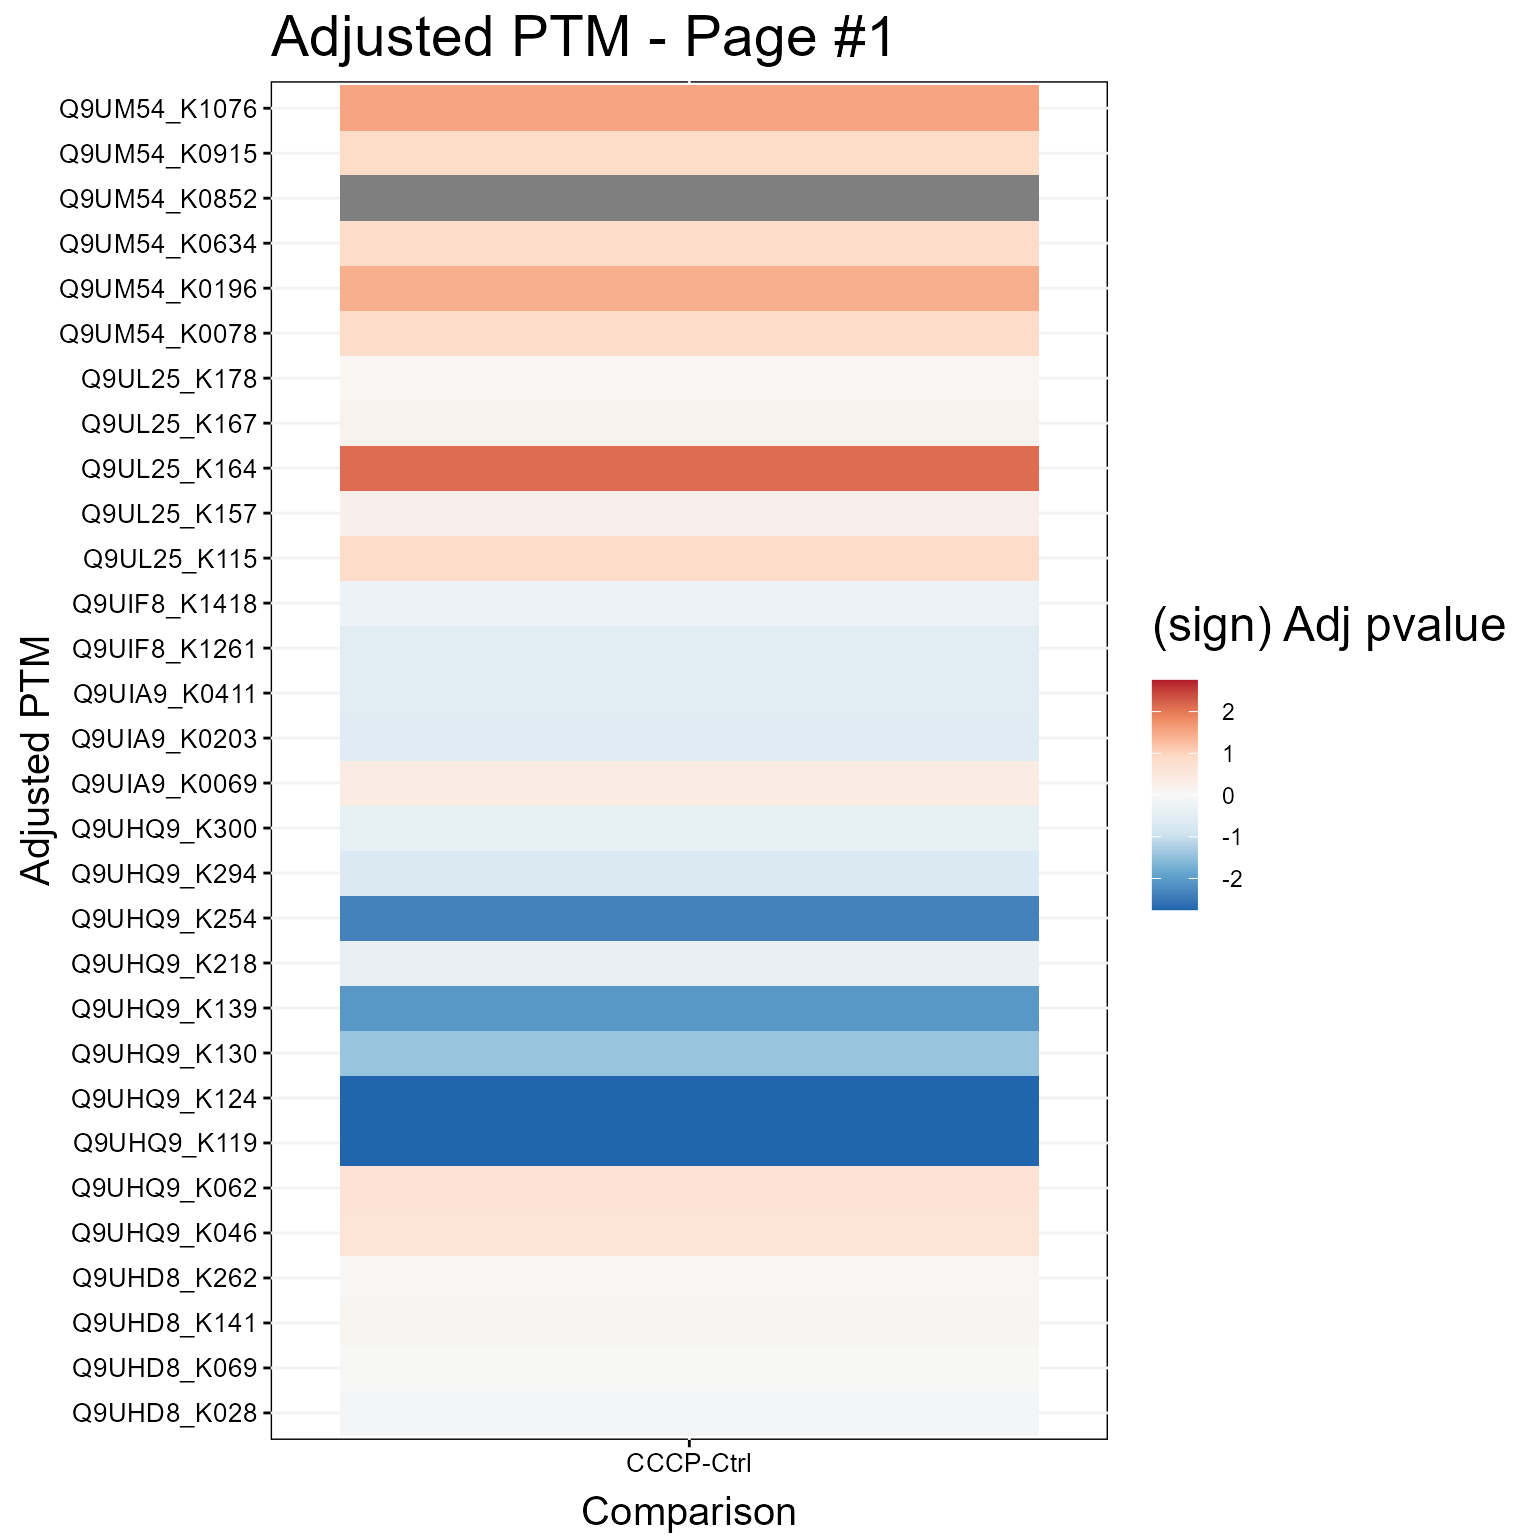
1.3.2 Heatmap Plot
Here we show a Heatmap for the models.
groupComparisonPlotsPTM(data = MSstatsPTM.model,
                        type = "Heatmap",
                        which.PTM = 1:30,
                        address=FALSE)
