May Institute Essentials

November 2 – 6, 2026 10:00 a.m. – 12:30 p.m. EST

7:00–9:30 a.m. PST  ·  4:00–6:30 p.m. CET

A condensed, fully virtual May Institute: one week of computation and statistics for mass spectrometry–based proteomics.

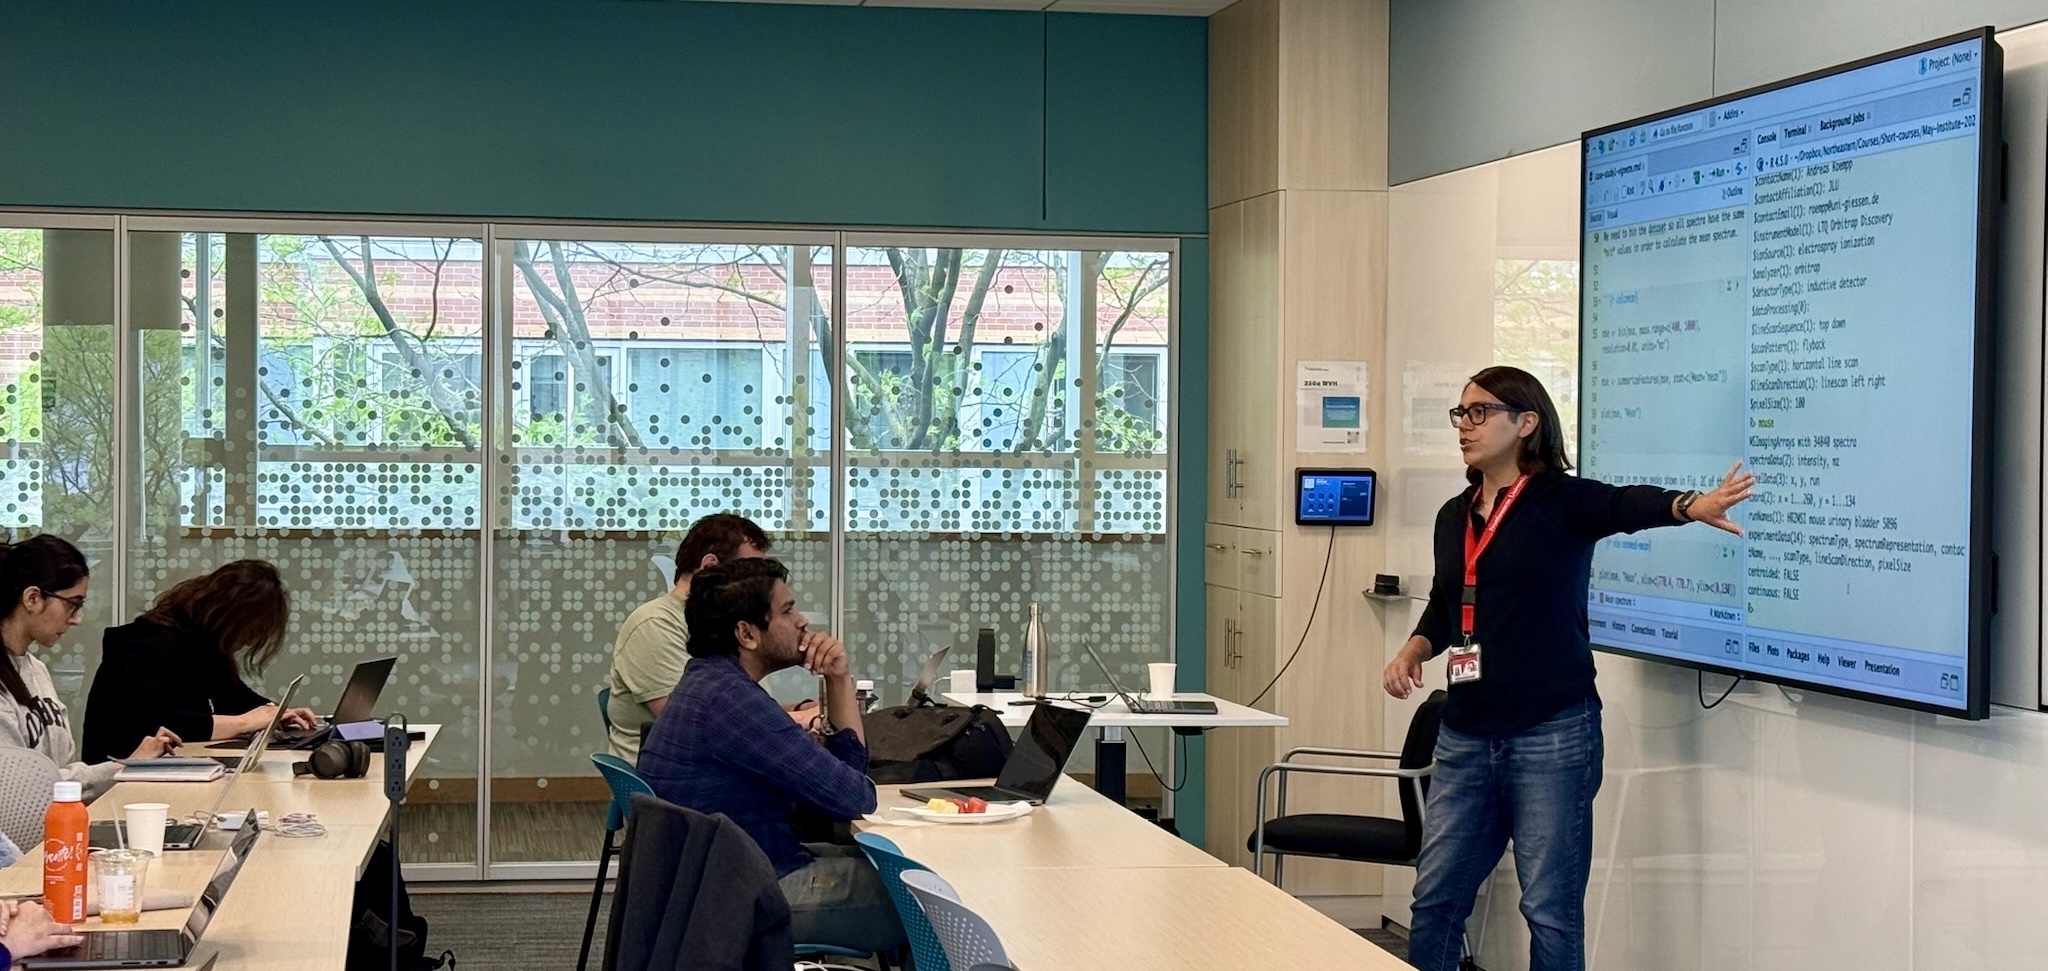
Instructors leading a hands-on Skyline session at the May Institute

About

Online, just the essentials

You asked, we listened: we are launching May Institute Essentials, a condensed, fully virtual version of May Institute, Fall edition. Over one week, sessions combine brief and crisp introductions to MSstats, Cardinal, and INDRA, general discussion, and 1:1 office hours with the developers.

The program is intended for both early career researchers and established scientists seeking to strengthen their expertise. Sessions run online each day from 10:00 a.m. to 12:30 p.m. Eastern Time.

May Institute Essentials is the minimalistic version of the in-person May Institute, taking place May 3 - 14, 2027 in Boston. See the May Institute program on the full program website.

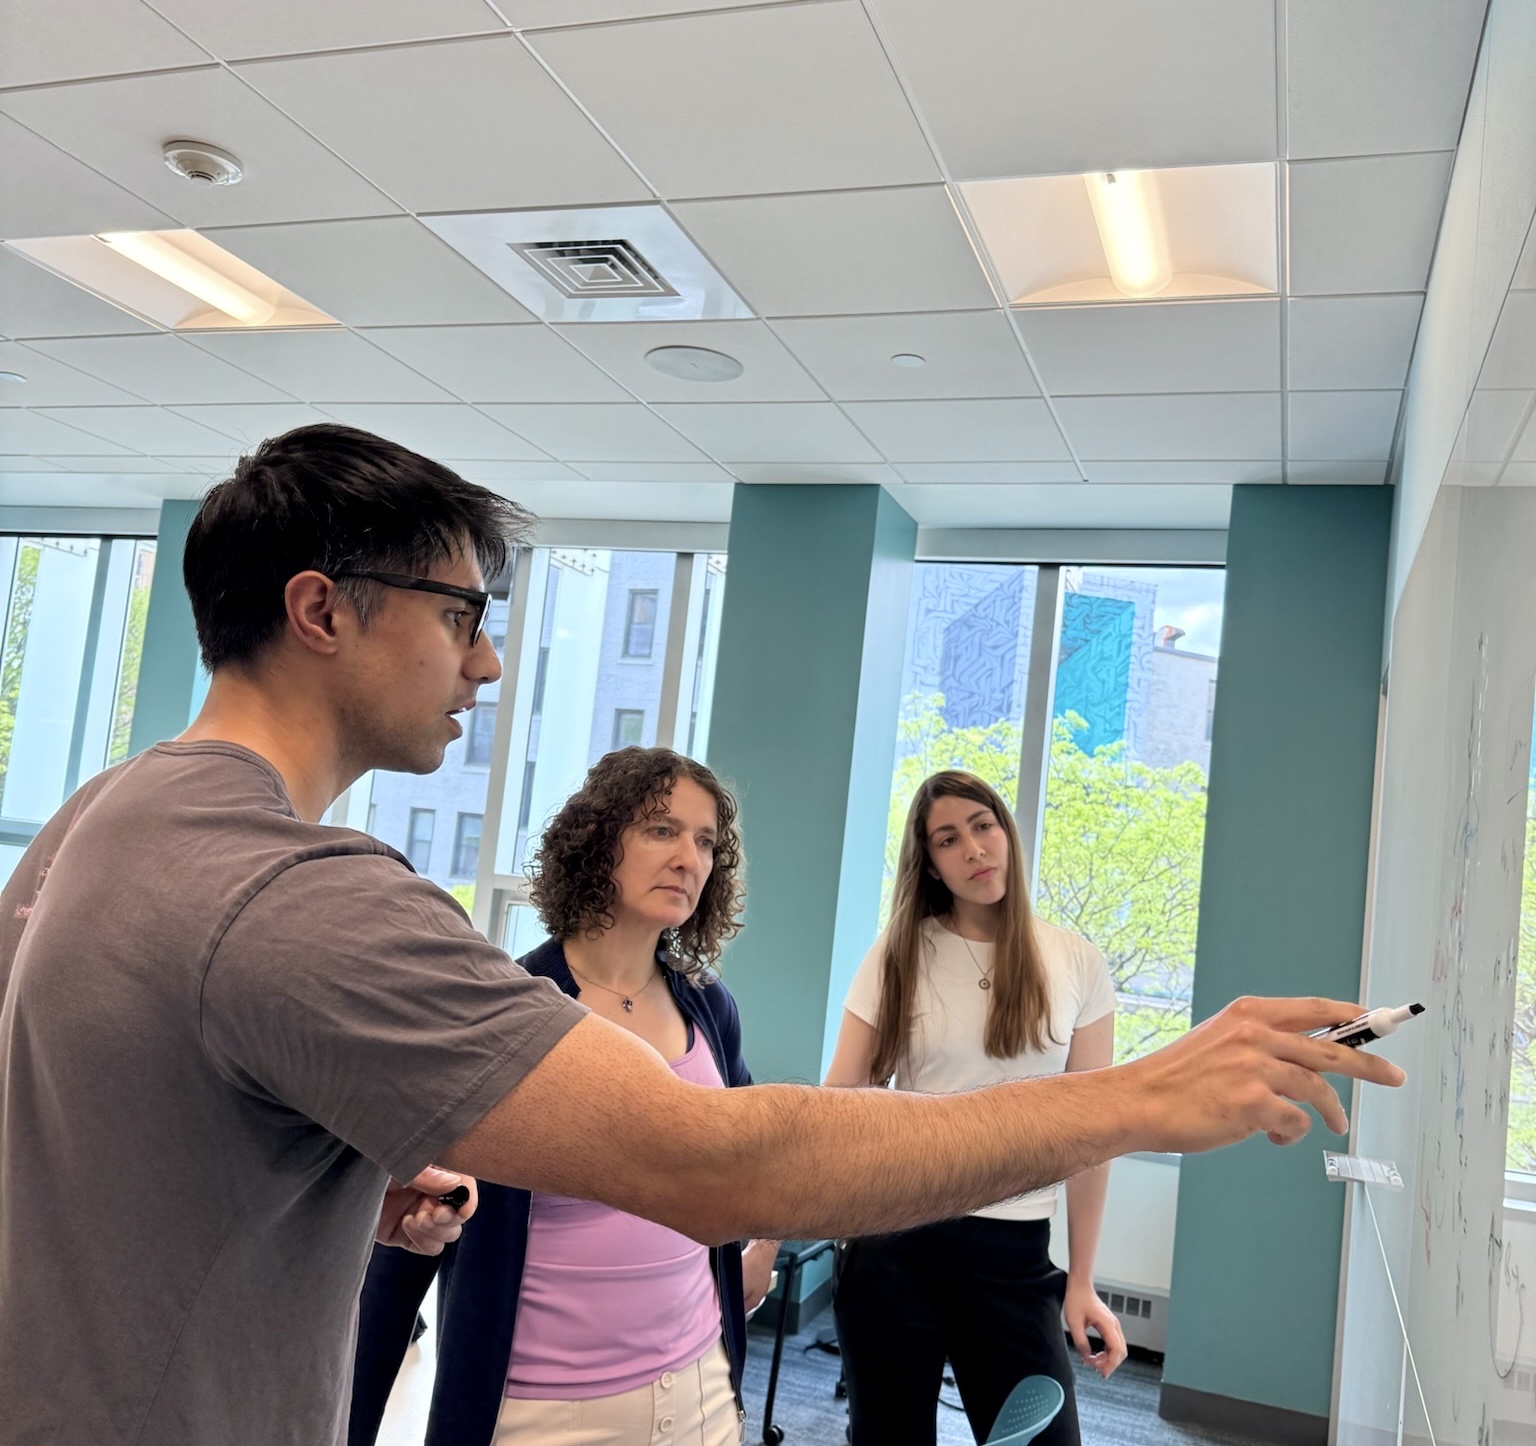
Discussion at the whiteboard during a May Institute session

Schedule

One week, five sessions

Three days of MSstats followed by two days of Cardinal. Each online session runs 10:00 a.m. – 12:30 p.m. EST (7:00 – 9:30 a.m. PST · 4:00 – 6:30 p.m. CET).

Nov 2
Monday
10:00 a.m.–12:30 p.m. EST
MSstats
MSstats Day 1: Differential analysis of label-free proteomics experiments
Modern DIA experiments can quantify thousands of proteins, but turning that output into conclusions you can trust is where many analyses go wrong. In this session we’ll walk through a complete workflow, from the reports of spectral processing tools like DIA-NN and Spectronaut to differential abundance results. We’ll cover the decisions that most affect your conclusions (normalization, missing values, feature selection, and protein summarization) and show how to choose the right statistical model for your design, including time courses, paired samples, and experimental covariates. We’ll use MSstats throughout, but the principles apply to any proteomics analysis tool. All hands-on work uses point-and-click web interfaces, so no programming experience is needed. You’ll leave able to take your own data from raw output to defensible results.
Devon Kohler, Sarah Szvetecz, and Tony Wu
MSstats Day 1 page →

Nov 3
Tuesday
10:00 a.m.–12:30 p.m. EST
MSstats
MSstats Day 2: PTMs & Chemoproteomics
Post-translational modification (PTM) and chemoproteomics experiments provide important insights into protein regulation and drug‐protein interactions, but introduce unique challenges for statistical analysis. PTM experiments often have limited measurements at individual modification sites and require distinguishing changes in PTM abundance from changes in overall protein abundance, while chemoproteomics experiments measure protein responses across multiple drug concentrations and may not follow a standard dose-response curve shape. In the first part of the session, we introduce MSstatsPTM, a tool for detecting differential PTM abundance while accounting for changes in overall protein abundance. The second part focuses on statistical modeling for chemoproteomics experiments with MSstatsResponse, which applies flexible dose-response modeling to protein‐ or PTM‐level data to reliably detect drug‐protein interactions, estimate IC50 values, and visualize response curves. Through hands-on examples in our RShiny GUIs, participants will gain practical skills for analyzing both experiment types.
Devon Kohler, Sarah Szvetecz, and Tony Wu
MSstats Day 2 page →
Nov 4
Wednesday
10:00 a.m.–12:30 p.m. EST
MSstats
MSstats Day 3: Interpretation with MSstatsBioNet and INDRA
Interpreting proteomics data using biological networks representing cellular mechanisms is a powerful approach to gaining actionable insights. In this course, we first introduce the INDRA system, developed by the Gyori Lab, which automatically assembles mechanisms into networks from both pathway databases and text-mined biomedical literature. We then dive deeper into the INDRA Database, the INDRA Network Search tool, and the INDRA Biomedical Discovery Engine which each facilitate gaining insights from data and generating hypotheses based on large-scale networks. Finally, we introduce MSstatsBioNet, which queries INDRA to construct an experiment-specific biological subnetwork from statistical results of MS proteomics experiments, facilitating biological interpretation. The course will be conducted using web-based UIs and RShiny GUIs.
Tony Wu and Benjamin Gyori
MSstats Day 3 page →
Nov 5
Thursday
10:00 a.m.–12:30 p.m. EST
Cardinal
Cardinal Day 1: Introduction to Cardinal, preprocessing, and visualization
In this session we will cover the basics of Cardinal, beginning with Cardinal's data structures and the .imzML format as well as the basics of working with larger-than-memory datasets. We will then cover preprocessing of MSI data, including recalibration, peak picking, peak alignment, and normalization as well as common operations like subsetting and summarizing pixels and features. We will end with visualization of spectra and single ion images.
Kylie Bemis, Sai Srikanth Lakkimsetty, Ethan Rogers, and Yinyue Zhu
Cardinal Day 1 page →
Nov 6
Friday
10:00 a.m.–12:30 p.m. EST
Cardinal
Cardinal Day 2: Case studies on statistics and machine learning with MSI data
This session will cover analysis of preprocessed MSI data. First we will cover region of interest (ROI) discovery using Cardinal's univariate and multivariate segmentation methods. We will then conclude with a case study of differential abundance between ROIs and experimental conditions.
Kylie Bemis, Sai Srikanth Lakkimsetty, Ethan Rogers, and Yinyue Zhu
Cardinal Day 2 page →

Lecture titles and topics will be updated as the program is finalized.

Cost

Registration

A single fee covers the full week of sessions.

Academic / Non-profit
$50

For participants from academic, non-profit, and governmental organizations.

Industry
$100

For participants from commercial organizations.

Registration includes:

  • Access to the full week of online sessions
  • Interactive discussion with presenters
  • 1:1 office hours with the tool developers on any topic related to experimental design, data analysis, or code debugging
  • Presentation materials including slides, code, and datasets
  • Early access to presentation recordings
Register now

Registration is processed through Northeastern University’s payment portal. Fee schedule is determined by the participant’s primary affiliation. We may ask for proof of affiliation at or after registration. Unfortunately, we are unable to offer refunds.